Gene Expression Signature Matching to Identify Drug Repurposing Candidates
Source:vignettes/gene_expression_signature_matching_example.Rmd
gene_expression_signature_matching_example.RmdAuthor: Patrick Wu
Date: 2021-04-05
Set up packages
Install required packages
install.packages("janitor")
devtools::install_github("pwatrick/DrugRepurposingToolKit")
devtools::install_github("pwatrick/pwUtilities")
Import packages
Load tutorial data
dr_ts_tutorial_data <- DrugRepurposingToolKit::dr_ts_tutorial_data
spredixcan_phenotype_ts <-
  dr_ts_tutorial_data$spredixcan_phenotype_ts %>%
  select(gene_name, zscore, pval) %>%
  arrange(zscore)
cmap_genes <- dr_ts_tutorial_data$cmap_genes
ilincs_output <- dr_ts_tutorial_data$ilincs_output
ilincs_simvastatin_dm4740 <- dr_ts_tutorial_data$ilincs_simvastatin_dm4740
pres_drugs <- dr_ts_tutorial_data$pres_drugs
Prepare phenotype gene expression signatures
#Keep only genes with connectivity map genes
spredixcan_phenotype_ts1 <-
  inner_join(spredixcan_phenotype_ts,
             cmap_genes,
             by = "gene_name") %>%
  arrange(zscore)

#Prepare genes for input into iLINCS
ts_up50 <- tail(spredixcan_phenotype_ts1, 50) #Top 50 most upregulated genes
ts_down50 <- head(spredixcan_phenotype_ts1, 50) #Top 50 most downregulated genes
ts_ilincs_input <- bind_rows(ts_up50, ts_down50) %>%
  arrange(desc(zscore))

pwUtilities::show_results_table(ts_ilincs_input, 10)
Example of gene expression signature matching
The plot below shows the correlation between S-PrediXcan estimated phenotype gene expression signature for hyperlipidemia with iLINCS drug perturbation data for simvastatin, a known cholesterol-lowering drug.
# Process iLINCS simvastatin data
names(ilincs_simvastatin_dm4740) <- tolower(names(ilincs_simvastatin_dm4740))
ilincs_simvastatin_dm4740 <-
  ilincs_simvastatin_dm4740 %>%
  select(name_genesymbol, value_logdiffexp, significance_pvalue)
names(ilincs_simvastatin_dm4740) <- c("gene_name", "log_diff_exp", "pvalue_ilincs")

simvastatin_hld_ilincs_merged <-
  inner_join(ts_ilincs_input,
             ilincs_simvastatin_dm4740,
             by = "gene_name")

simvastatin_hld_ilincs_merged1 <-
  simvastatin_hld_ilincs_merged %>%
  mutate(
    gene_name_label = if_else(gene_name == "LDLR", gene_name, "")
  )

hld_dm4740_plot <-
  ggplot(simvastatin_hld_ilincs_merged1,
         aes(zscore, log_diff_exp, label = gene_name_label)) +
  geom_point(
    color = ifelse(simvastatin_hld_ilincs_merged1$gene_name_label == "", "grey50", "red")
    ) +
  labs(x = "S-PrediXcan estimated gene expression for hyperlipidemia (zscore)",
       y = "iLINCS gene expression for simvastatin (Log2DE)",
       title = "S-PrediXcan phenotype = Hyperlipidemia; iLINCS drug = Simvastatin") +
  geom_vline(xintercept = 0) +
  geom_hline(yintercept = 0) +
  geom_smooth(method=lm, se = FALSE) +
  ggrepel::geom_text_repel() +
  annotate("text", x = 5, y = 0.22, label = "Weighted correlation = -0.32, P = 0.026") +
  annotate(
    geom = "segment", x = 5, y = 0.20, xend = 5, yend = -0.02, arrow = arrow(length = unit(2, "mm"))
  ) +
  theme_bw()

hld_dm4740_plot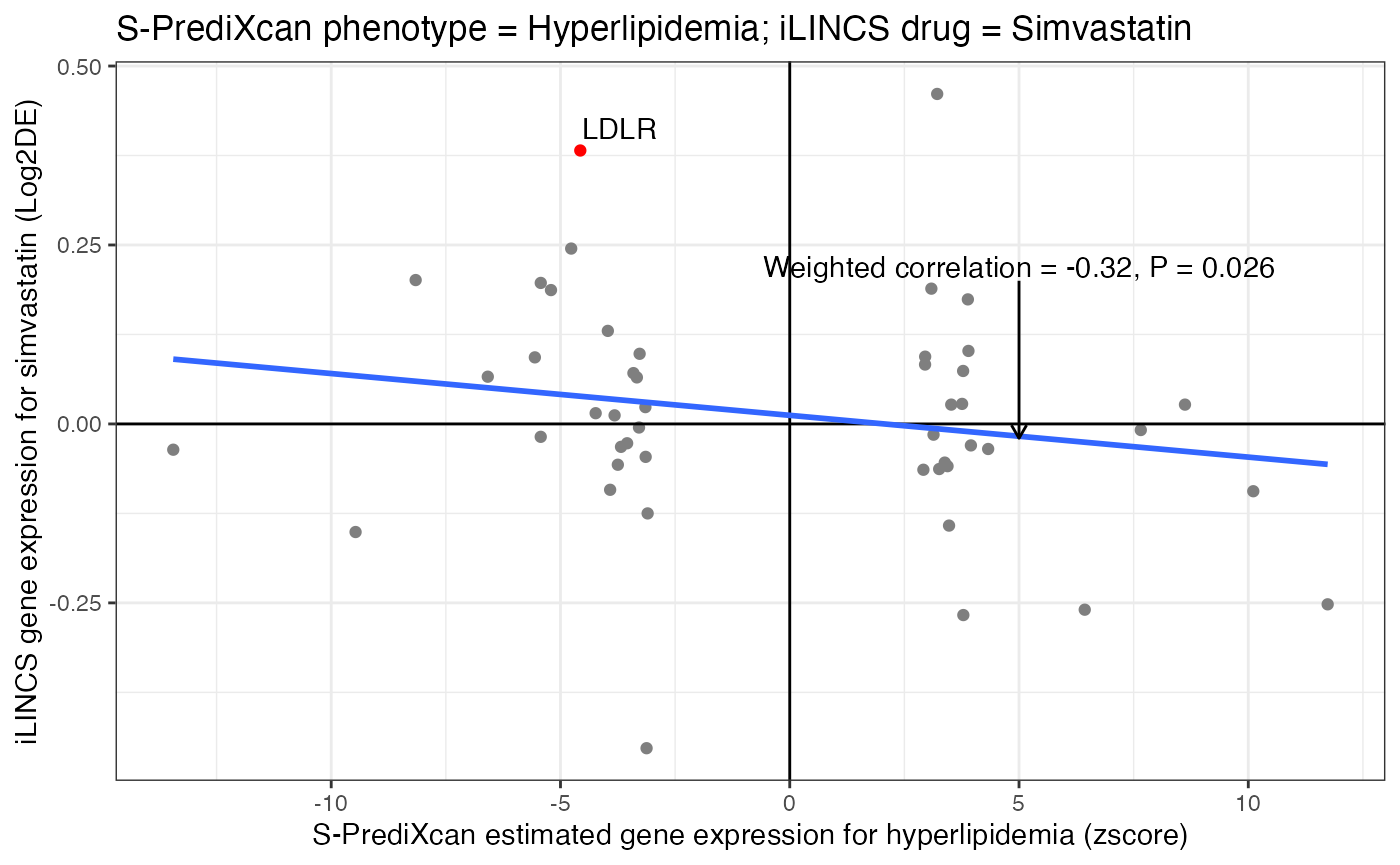
Each point represents one gene. Since simvastatin is a known lipid-lowering drug, simvastatin induced gene expression signature was predicted to reverse the S-PrediXcan estimated gene expression signature for hyperlipidemia (Weighted correlation = -0.32). The blue line indicates the expected negative correlation between S-PrediXcan estimated hyperlipidemia gene expression signature (horizontal axis) and iLINCS simvastatin induced gene expression signature (vertical axis). As expected, the LDLR gene (red point) was downregulated in patients (x-axis value = -4.57) with hyperlipidemia and upregulated in simvastatin perturbation experiments (y-axis value = 0.382). iLINCS: Integrative Library of Integrated Network-Based Cellular Signatures.
Process iLINCS output, list of drug repurposing candidates
#Map to drug ingredients
##Map perturbagens to RxCUIs
ilincs_output1 <- inner_join(ilincs_output, DrugRepurposingToolKit::ddi_rxcui_names, by = c("perturbagen" = "drug_name"))
ilincs_output2 <- inner_join(ilincs_output1, DrugRepurposingToolKit::ddi_rxcui2in, by = "rxcui") %>%
  select(signatureid, rxcui_ingr_name, rxcui_ingr, concentration, tissue, time, concordance, pvalue)

#Keep only drugs with negative concordance
ilincs_output3 <- ilincs_output2 %>%
  filter(concordance < 0)

#Exclude nonprescription drugs
pres_drugs <- pres_drugs %>% select(rxcui_ingr)
ilincs_output4 <- inner_join(ilincs_output3, pres_drugs, by = "rxcui_ingr")

n_distinct(ilincs_output4$rxcui_ingr_name) #106 unique drugs left
#> [1] 106After excluding non-prescription drugs, there were 106 unique drugs remaining for clincal validation studies.
See remaining drugs
pwUtilities::show_results_table(ilincs_output4, 10)Metadata
spredixcan_phenotype_ts:
- A table with gene expression values for hyperlipidemia estimated using S-PrediXcan and genome-wide association study (GWAS) summary statistics.
- S-PrediXcan was trained using Genotype-Tissue Expression (GTEx),[1] a data set with genotypes linked to RNA-seq data for 44 human tissues. The gene expression signature for hyperlipidemia was estimated using the whole blood elastic net model (tissue = “TW_Whole_Blood_Elastic_Net_0.5”)[2] and GWAS summary statistics from the Global Lipids Genetics Consortium with 188,577 individuals (phenotype = “GLGC_Mc_LDL”).[3,4] The file was downloaded from “https://s3.amazonaws.com/imlab-open/Data/MetaXcan/results/metaxcan_results_database_v0.1.tar.gz”.
cmap_genes:
- A table with list of 11,911 genes from the ConnectivityMap[5]
ilincs_output:
- A table with drug repurposing candidates from iLINCS/DrugMatrix[6,7]
- Output from uploading top 50 upregulated and top 50 downregulated genes from S-PrediXcan estimated phenotype gene expression signature for hyperlipidemia.
ilincs_simvastatin_dm4740:
- A table with gene expression values from primary rat hepatocytes treated with simvastatin.
- Signature ID = DM_4740.
pres_drugs:
- A table with prescription drugs, derived from RxNorm,[@] using CVF flag = 4096.